If you’ve ever looked at a stock chart and seen a squiggly line that’s smoother than the price action itself, chances are you’ve spotted the moving average. But let’s break it down eejit-style, shall we?
What is the moving average?
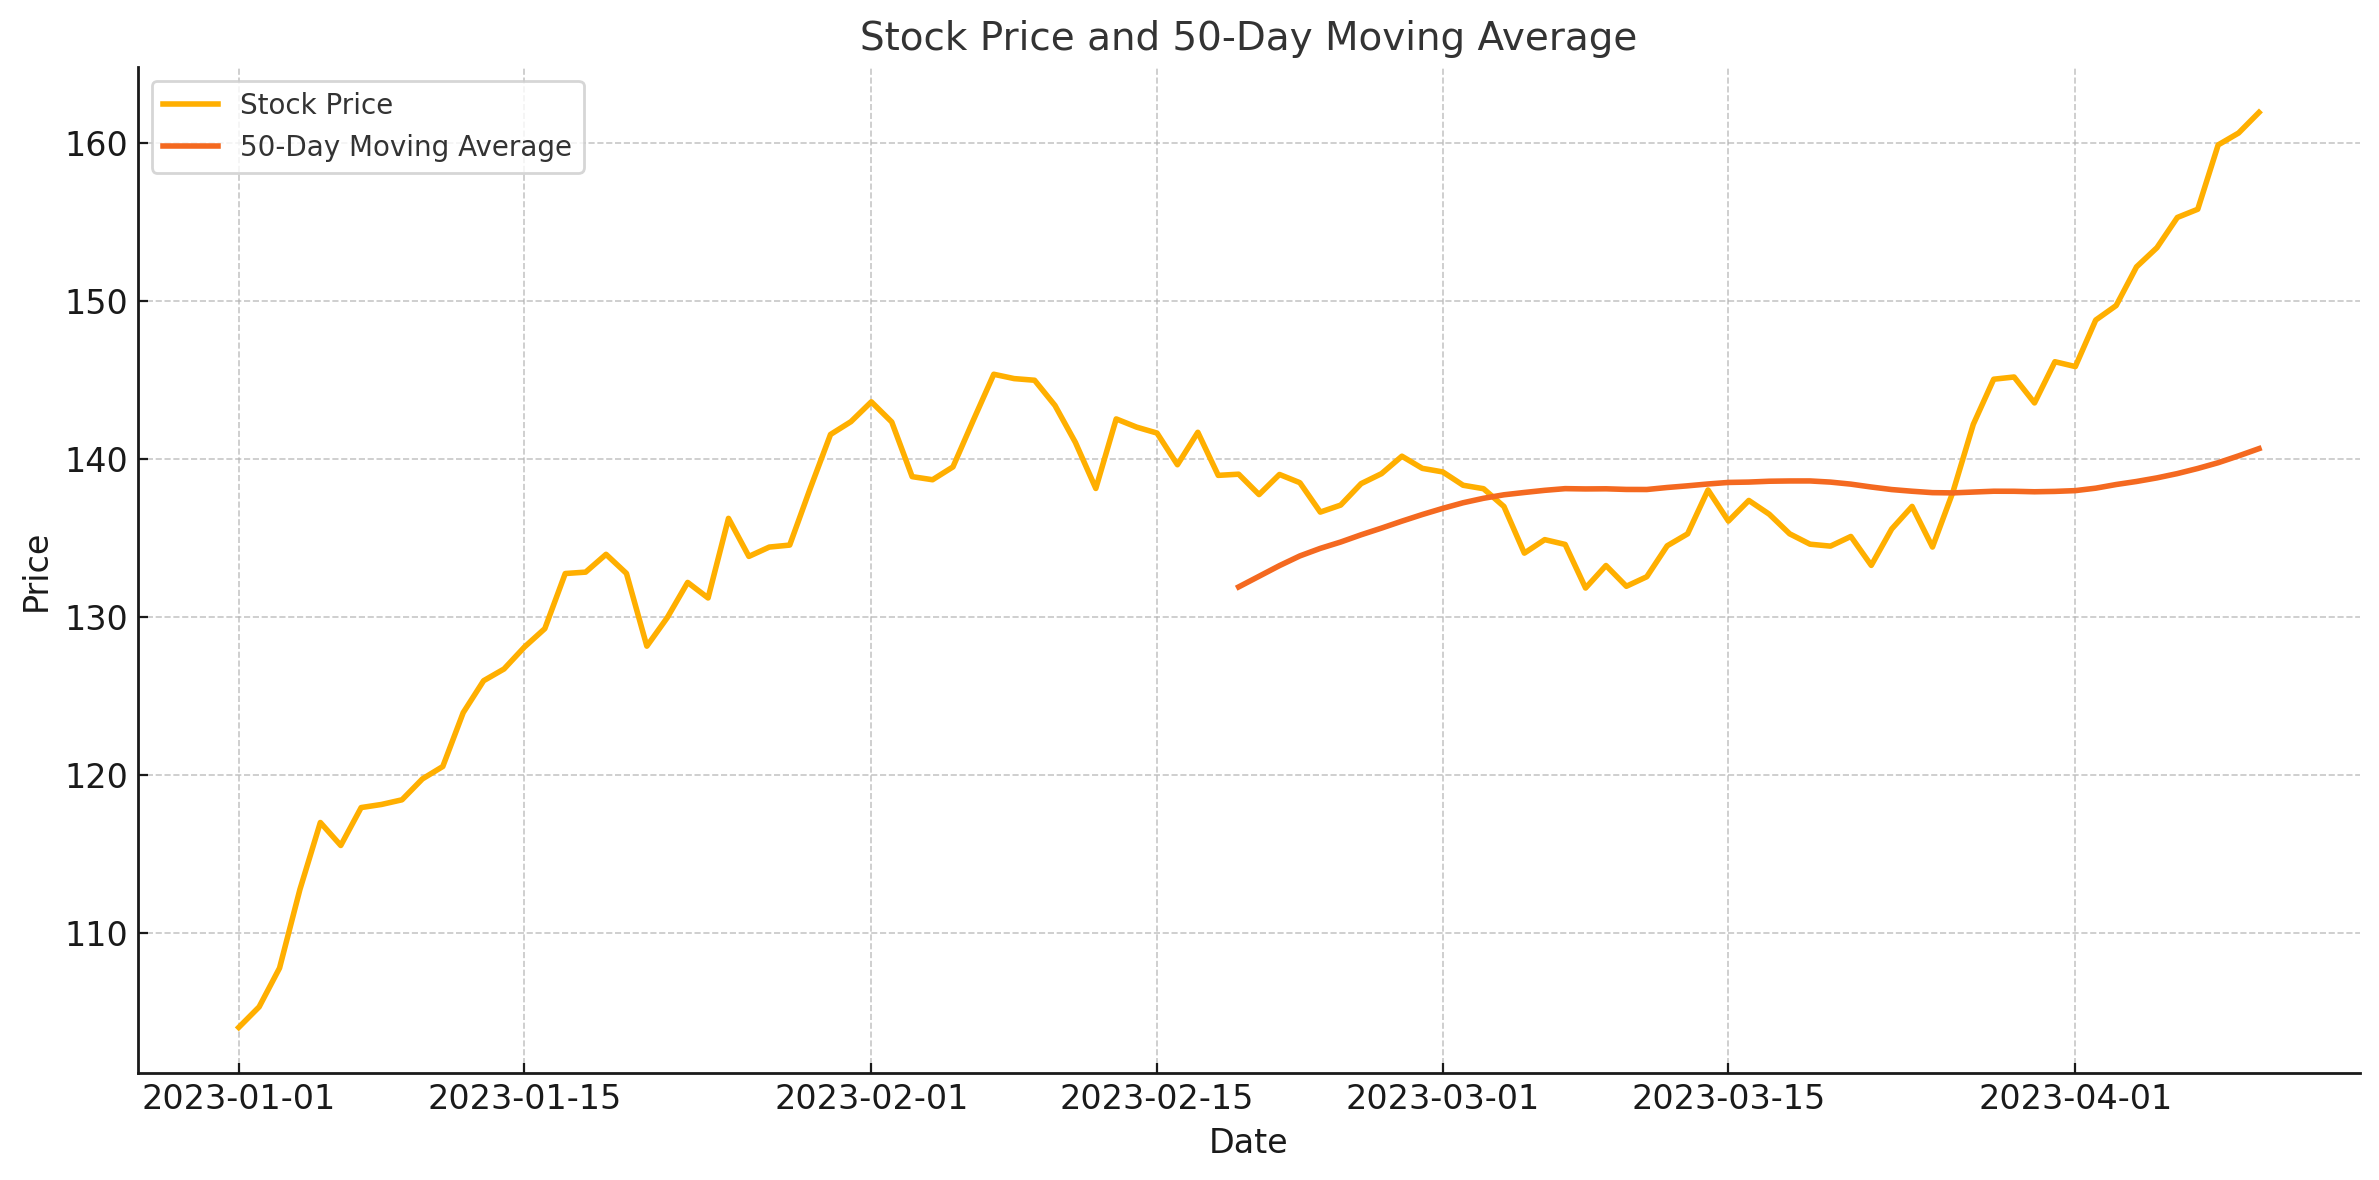
The moving average is an indicator that adds up the closing prices over a set time period (like 50 days), divides the total by that number, and plots the result as a point on a chart.
If you’re looking at a daily chart, it plots a new point for each day, based on the previous 50 days of data. This gives you a smooth line that helps show the general direction the price has been heading — up, down, or sideways.
Let’s say you want to track your energy costs. Each day, you jot down the cost. After 50 days, you calculate the average. Then, as you keep tracking, you always use the last 50 days to update the average. If, say, days 50 to 60 are higher than the earlier days, your average starts rising. Boom, you’ve got an upward trend.
The moving average is usually written as xMA, where “x” is the number of periods. So a 50-day moving average becomes 50MA.
Why would we care?
Good question!
The moving average is useful because:
It smooths out the noise. Markets jump around like Kris Kross (google it). The MA helps cut through the chaos and shows if the general direction is up, down, or neither.
It’s dead simple. If the price is above the MA, it’s often a sign of an uptrend. If it’s below, you might be looking at a downtrend. Not always, but it’s a solid starting point.
Why use the 50 moving average?
The 50MA is popular — especially on daily charts. It’s the Goldilocks option:
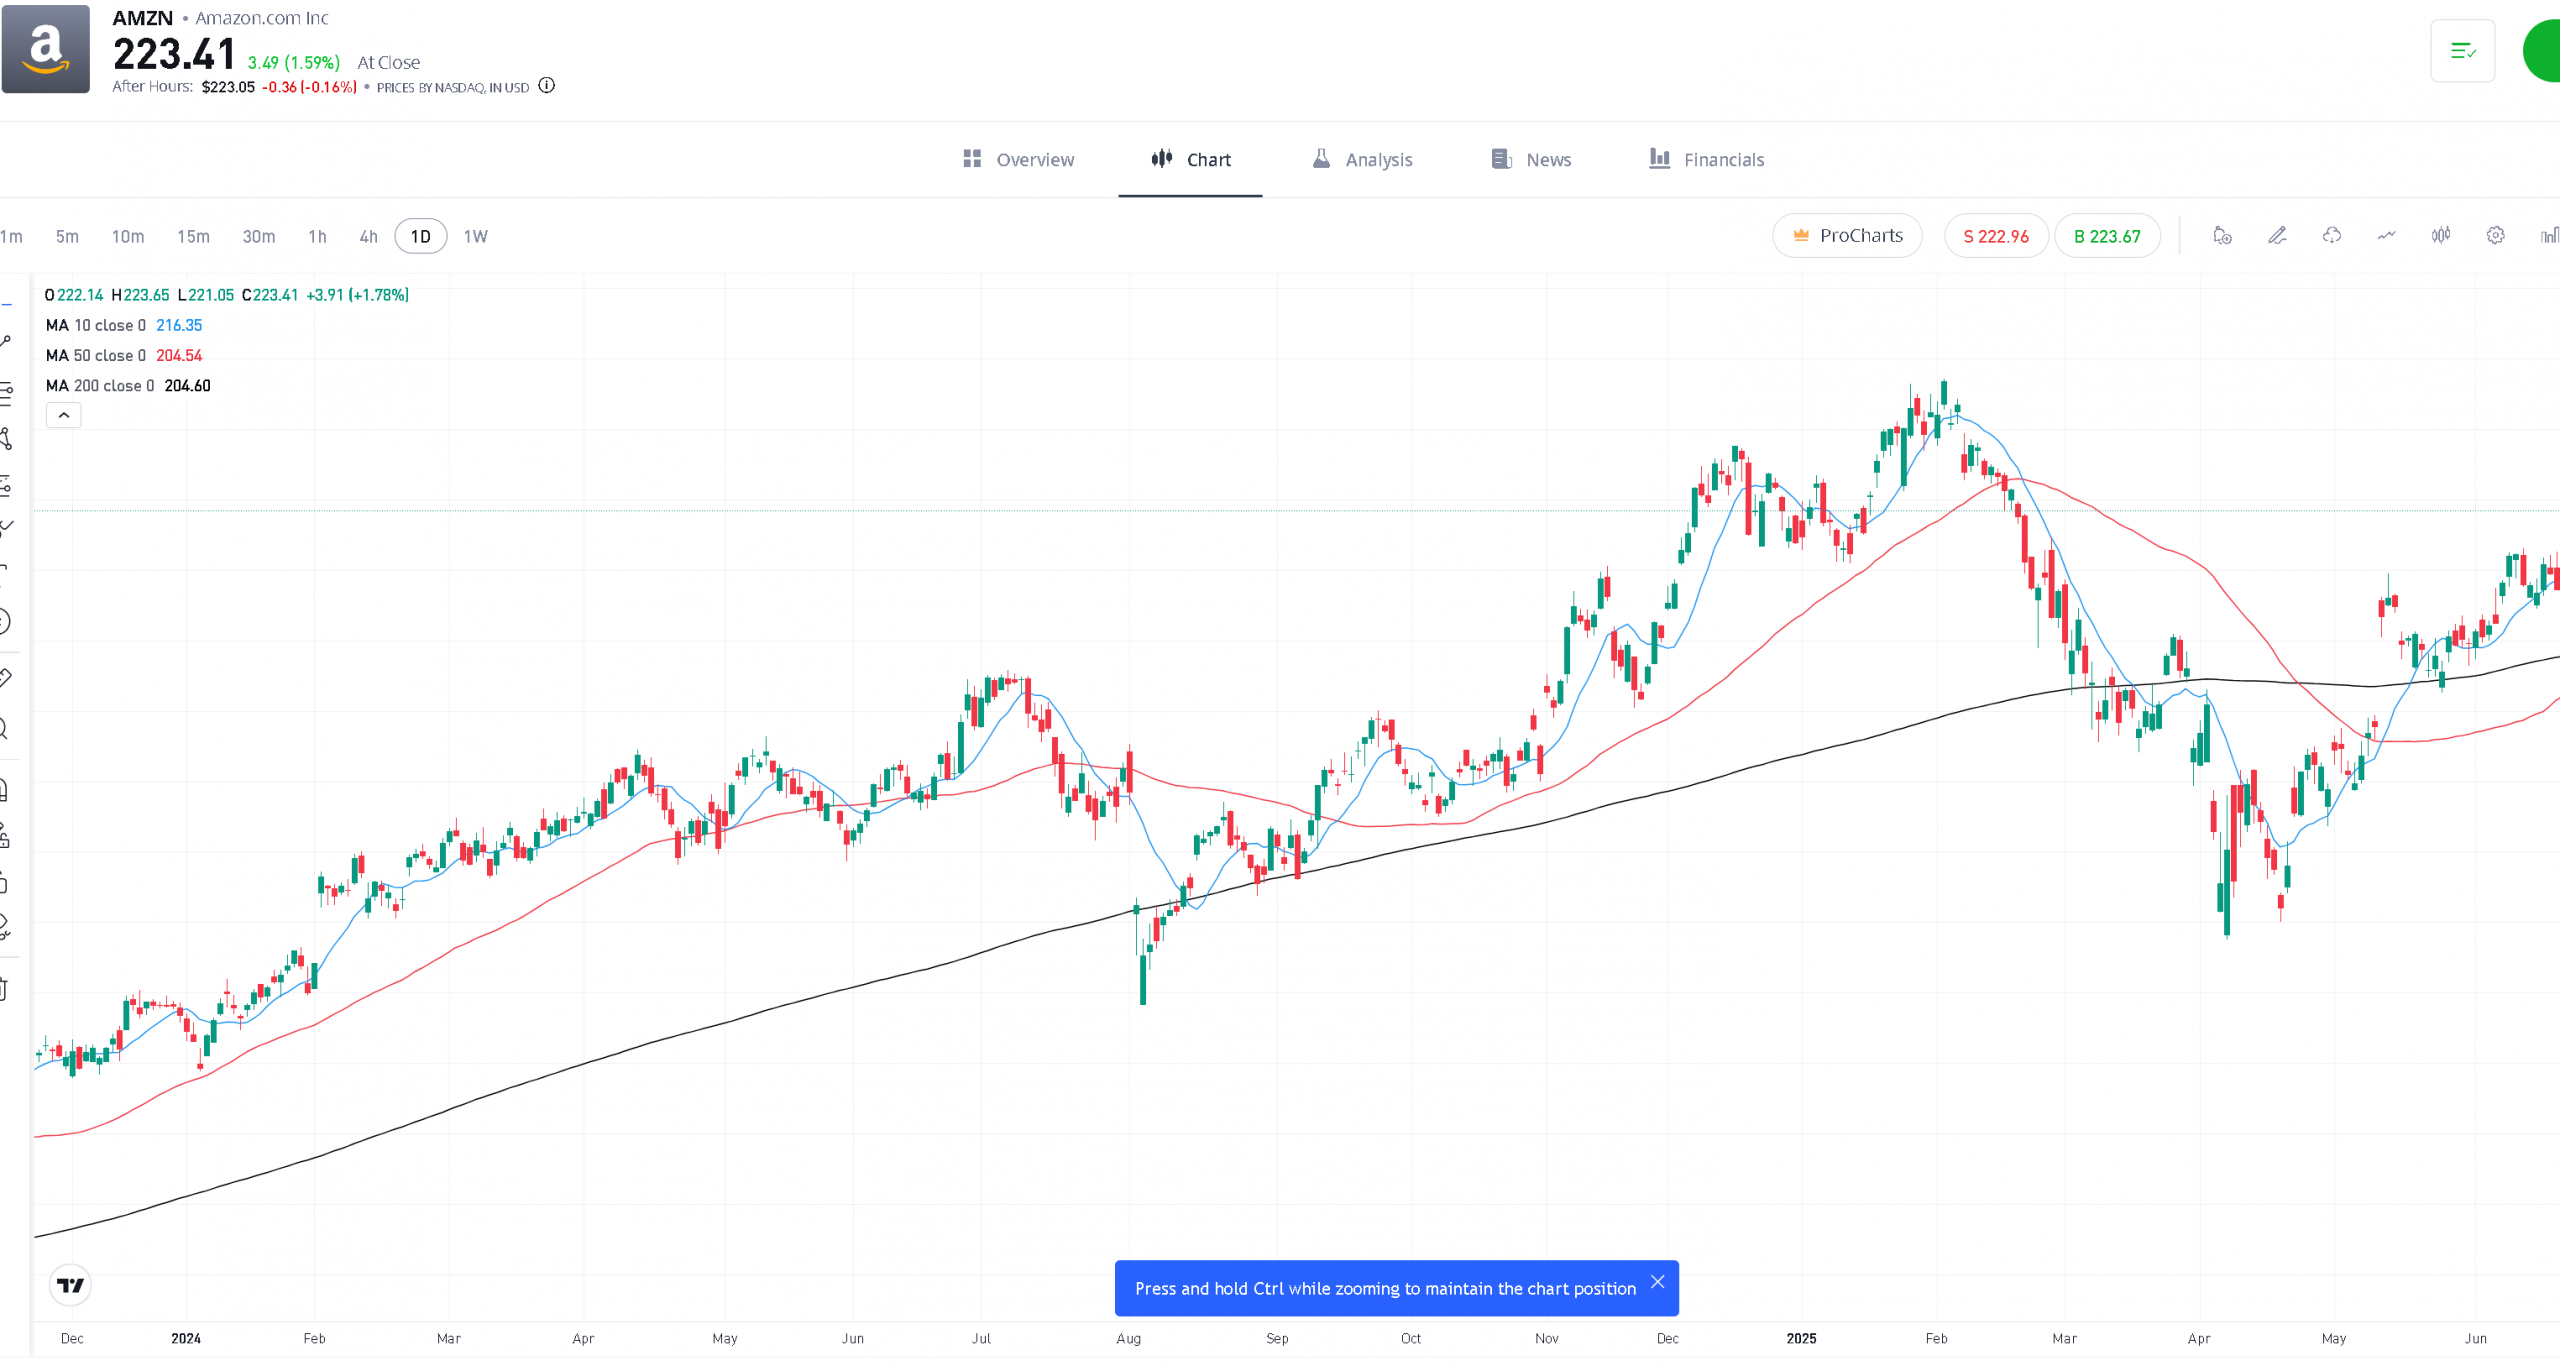
Not too short (like the 10MA, which reacts to every spike in the market),
Not too long (like the 200MA, which moves slower than your mate paying you back).
It’s middle-of-the-road — responsive, but not twitchy.
Different timeframes suit different styles:
200MA is useful for long-term investors. It gives a big-picture view and ignores short-term wobbles.
10MA is better for fast-paced, short-term trading. Quick in, quick out.
50MA sits nicely in the middle, making it ideal for swing traders or those who want to catch the trend without jumping at every candle.
Because so many traders use the 50MA, it can act like a self-fulfilling prophecy. When the price drops to the 50MA, it often bounces off it, like it’s testing a glass floor. If it breaks through, that can be a signal of a potential trend change.
It almost becomes a psychological level. Traders react to it just because everyone else is reacting to it.
Imagine your brain is made of three MAs:
10-day MA: Feels the heat instantly — pulls your hand off the stove before you’ve even realised.
50-day MA: Starts sensing something’s off — not burning yet, but preparing to act.
200-day MA: Still wondering what smells like bacon.
Each one has its use. If you’re after quick in, quick out, maybe go with the 10. If you’re investing for years, the 200 might suit you better. The 50 is your middle-ground. It gets the vibe before things go too far.

Eejit Thoughts
The moving average isn’t fancy. It’s just a way to see if the asset you’re watching is heading up, down, or absolutely nowhere. Like tracking your weight over time. One donut won’t change the chart, but 50 days of donuts? That line’s climbing.
So when someone yells “It’s below the 50MA!!”, what they really mean is:
“My hand’s starting to feel the heat!”
Personally, I find it easier (and less risky) to trade with the trend rather than against it. Following the direction of the moving average reduces the guesswork. Of course, trends can shift and what looks like an uptrend can reverse. But if you’re using longer timeframes, the moving average can be a solid guide.
Next up, we’ll dive into what happens when moving averages cross each other, aka “Golden Crosses”, “Death Crosses”, and all that dramatic stuff. Stay tuned.


Leave a Reply