
Relative Strength Index (RSI)
The Relative Strength Index (RSI) is a rule-based momentum indicator that helps identify potential shifts in price direction. It’s particularly useful for spotting better entry and exit points in a trade. I use RSI to help confirm trends and in combination with other tools, rather than relying on it alone.
The value for RSI is usually between 0 and 100:
RSI < 30 → the asset might be oversold, suggesting the price could rise soon.
RSI > 70 → the asset might be overbought, suggesting the price could drop soon.
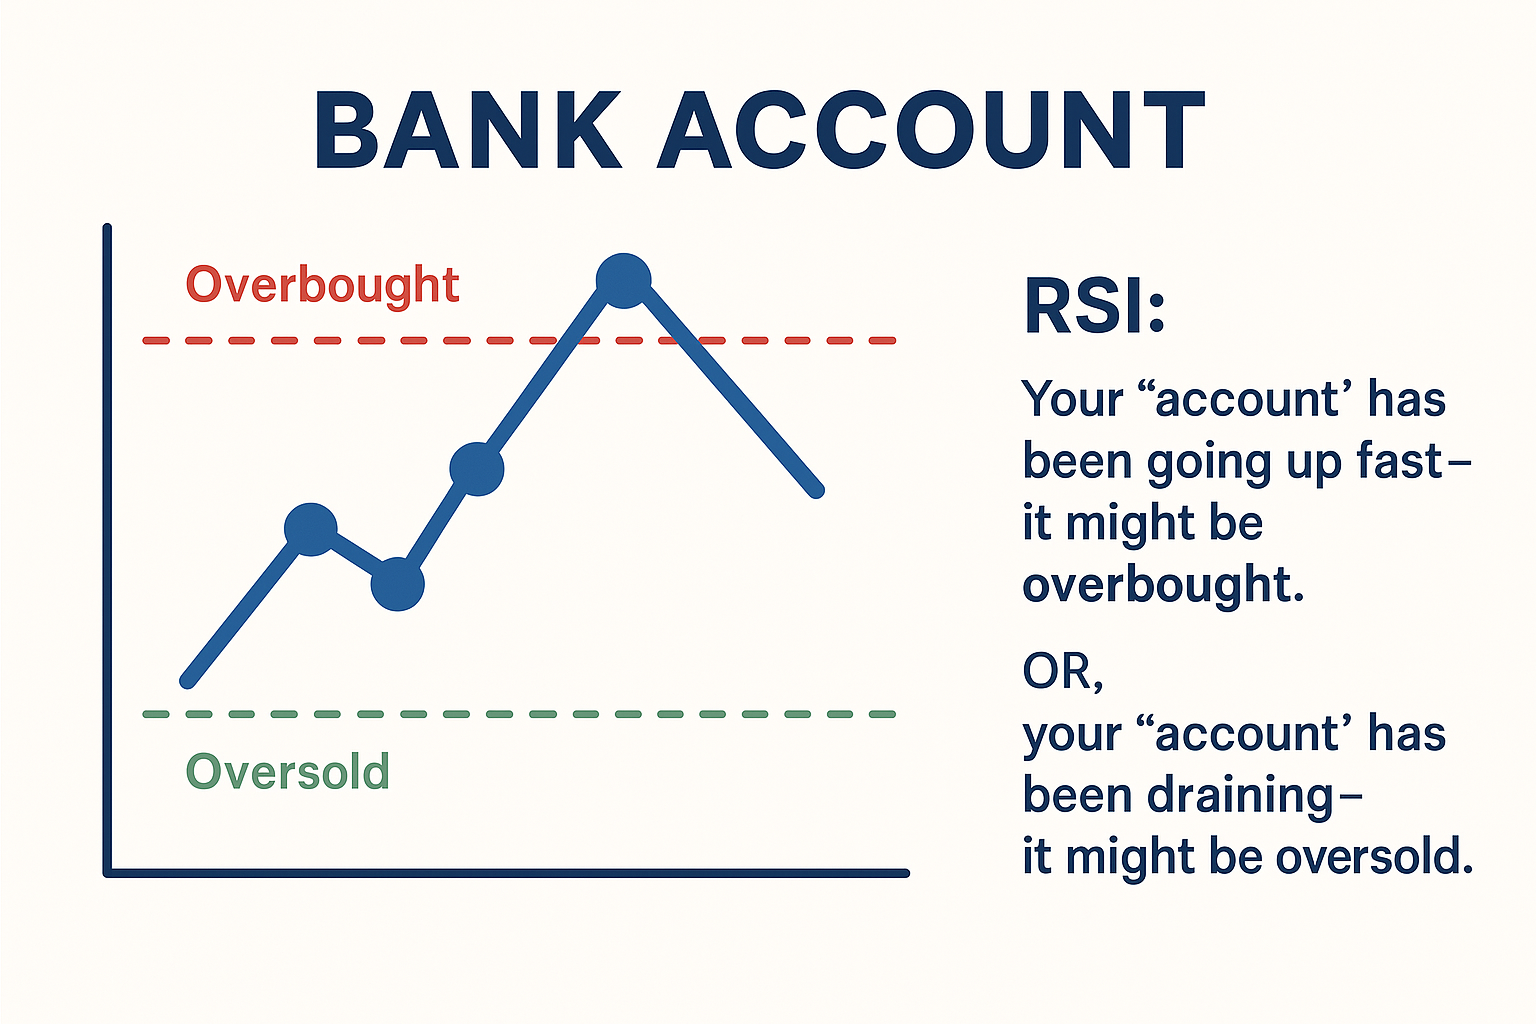
Bank Account Analogy
Think of your bank account: it goes up when you get paid and down when you spend.
Regular deposits that grow your balance are like a stock price going up.
Overspending and draining your account too quickly are like a stock price falling.
Now, imagine you’re tracking that account. If your balance has been climbing quickly and is unusually high, you might expect a drop soon — a spending spree. That’s similar to RSI being high (above 70): momentum has pushed prices up fast, and a pullback might be due.
On the other hand, if your account has been getting hammered by expenses, it might be time to top it up. That’s like RSI being low (below 30): prices have fallen fast, and a reversal may be near.
RSI is a signal that the current trend might be losing steam and could reverse.
Tap Analogy
Now picture a tap:
Turn it up, and water flow increases → like price rising.
Turn it down, and water slows → like price falling.
A tap is turned full-on for too long, it might be time to ease off — that’s similar to an overbought signal (RSI > 70).
If the flow slows to a trickle, maybe it’s time to open it again — that’s like an oversold signal (RSI < 30).
Relative Strength Index – Chart Example
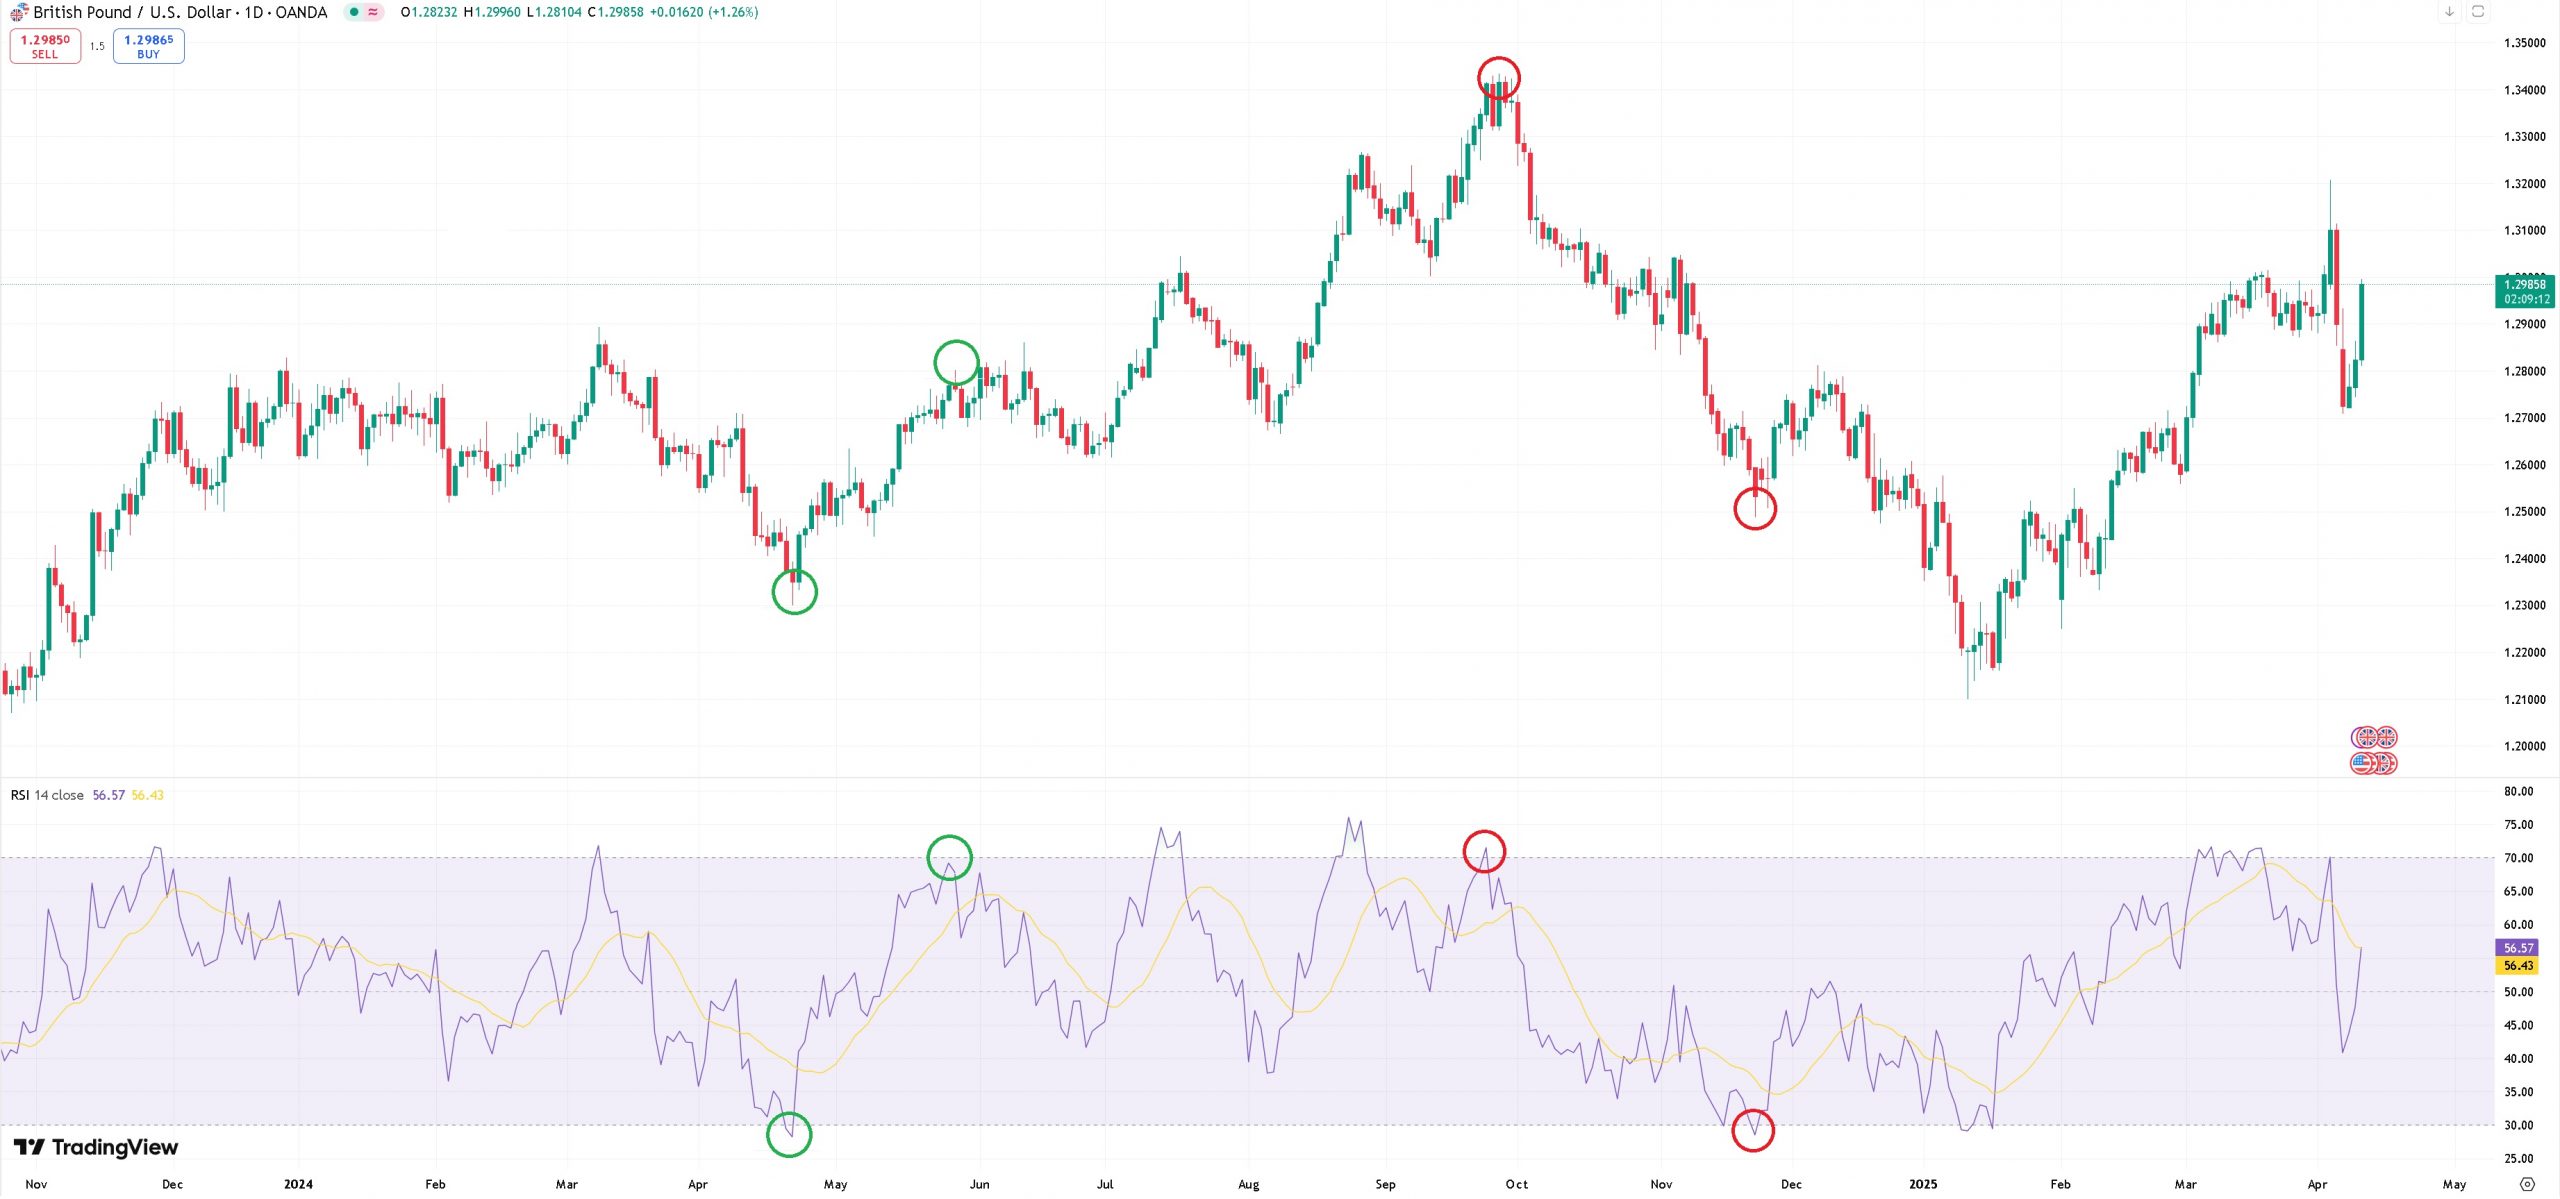
In the GBP/USD daily chart (Figure B), you can see:
In April 2024, RSI dipped below 30 (oversold), and the price rose into May (green circles on the chart).
A sharp price drop occurred from late September to the end of November 2024. RSI tracked this move, again providing clues to potential trend shifts.
RSI helps highlight areas where the trend might reverse. It’s especially useful for identifying buy/sell opportunities when paired with other tools or used within the context of the overall trend.
I’ve found that trades aligned with the trend tend to be more successful, and RSI works well across different timeframes.
Take a look at the chart again and see if you can spot other overbought or oversold areas using RSI. The more you practice reading it in context, the more useful it becomes.


Leave a Reply