
Support & Resistance
Support and resistance levels are everywhere in trading, and I like to keep things as simple as possible. These key levels can play a big role in different trading strategies, so it’s worth understanding them properly. Before we jump into some examples, let’s break them down in a way that makes sense.
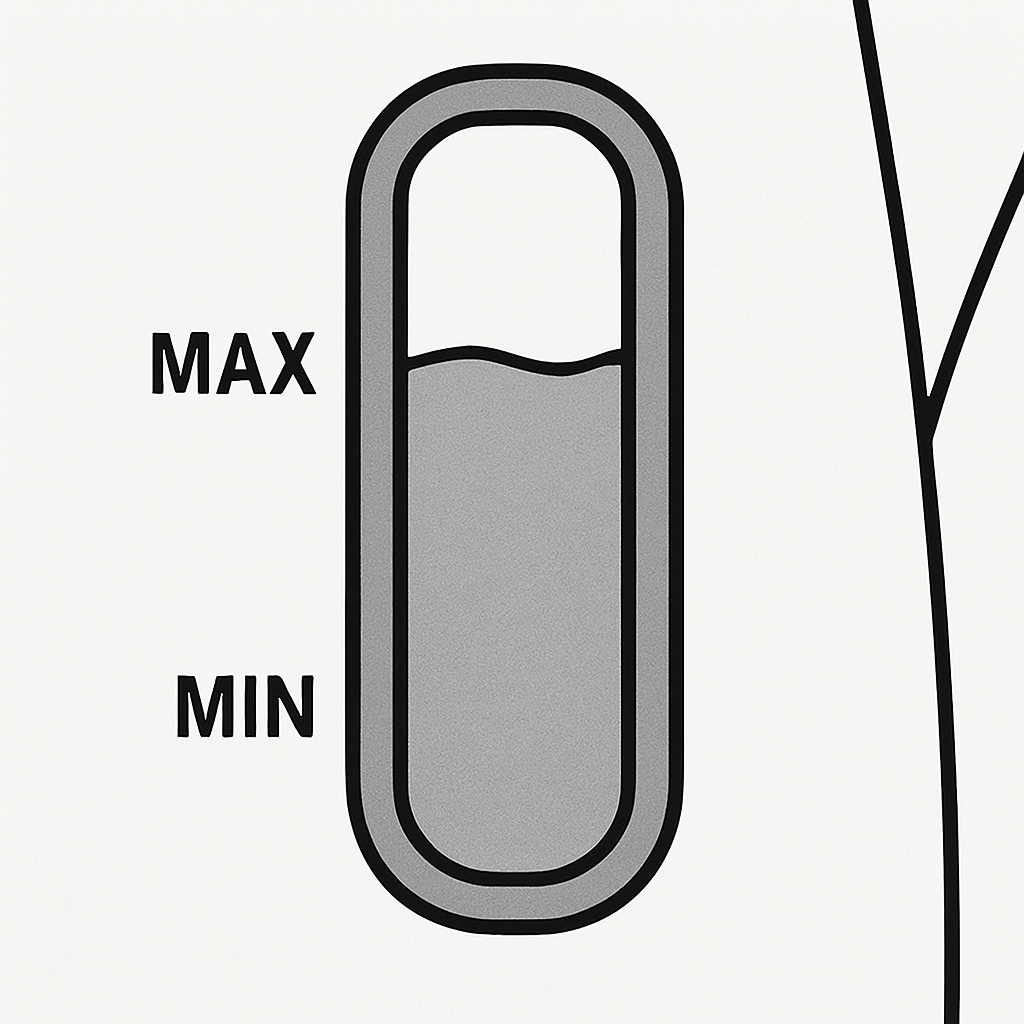
Support (Minimum Water Level)
Imagine you’re using an electric kettle. There’s usually a mark indicating the minimum & maximum water level, as shown in Figure A. For the minimum, you shouldn’t let the water drop below this point, or you risk damaging the kettle.
This is just like support in trading—when the price (water level) reaches this point, it tends to stop falling because there’s usually buying interest around this area.
However, if the kettle completely runs dry, the water level (price) breaks through support, which could lead to overheating (a bigger price drop to the next support level).
If water evaporates (selling pressure), it will eventually reach this level. But in most cases, you’ll refill it (buying pressure) before it runs dry.
Resistance (Maximum Water Level)
Now, think about the maximum water level on a kettle. If you pour in too much water, it could overflow. This is a great way to understand resistance in trading.
But if resistance holds, the water level (price) gets pushed back down because there’s too much pressure at that level.
If you keep adding water (strong buying pressure), it reaches the top and spills over (breaks resistance), meaning the price could continue rising.
Breaking Through Support or Resistance
If too much water evaporates (strong selling pressure), the level drops below support, likely leading to further decline.
If you pour more water with enough force (strong buying momentum), the level breaks above resistance, allowing for more upward movement.
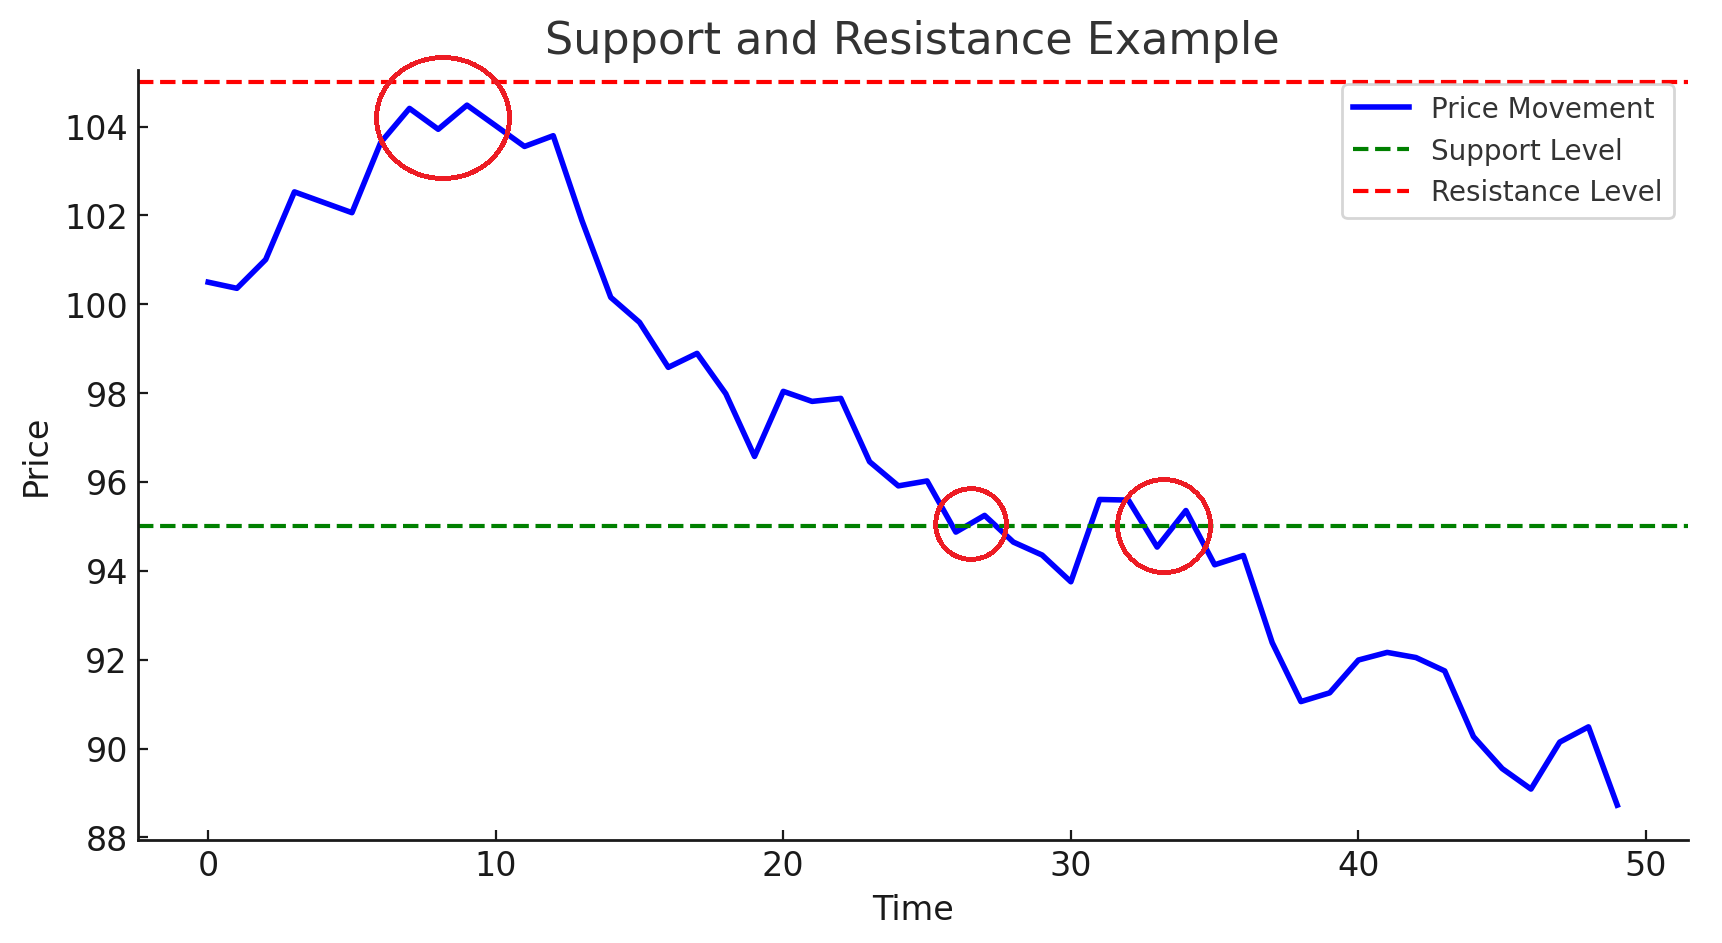
Figure B – Support & Resistance in a Chart
In Figure B, we can see support and resistance levels in action. Price tends to bounce off these key levels, coming close or touching them multiple times. This is why traders pay attention to these areas—they can signal potential entry and exit points.
While support and resistance are useful on their own, I find they work best when combined with other indicators. If you’re new to this, try looking at stock charts for assets you’re interested in. See if you can spot support and resistance levels, and think about how price reacts to them.
Once you start seeing these levels in action, they start to make a lot more sense!

Leave a Reply