
Are you using the Average True Range to trade with precision — or are you just guessing how much an asset can move each day?
Average True Range (ATR)
The Average True Range (ATR) is a technical indicator that measures an asset’s volatility based on real price movements, not guesswork.
ATR is usually calculated using 14 periods, which could be 14 hours, 14 days, or even 14 weeks, depending on the timeframe you’re looking at.
Here’s how it’s calculated:
ATR = (Previous ATR × (Number of periods − 1) + Current True Range) ÷ Number of periods
The True Range for the day is the largest of the following three values:
Today’s high minus today’s low, today’s low minus yesterday’s close or today’s high minus yesterday’s close.
It captures not just today’s price movement, but also any gaps between yesterday’s close and today’s open—because those gaps are part of real-world volatility too.
When the ATR is low, it means the asset’s daily (or hourly, or weekly) price ranges are small. In simple terms: lower ATR = lower volatility. On the flip side, a high ATR signals bigger price swings and higher volatility.
Why Use The Average True Range?
That’s a great question!
At first glance, the Average True Range (ATR) might not seem particularly useful, especially for long-term investors. If you’re planning to hold a position for 10 years, daily price fluctuations may seem irrelevant. Over such a long time horizon, short-term volatility tends to smooth out, and broader fundamentals or macro trends usually have a greater impact on your returns.
For active traders with short holding periods, the Average True Range is extremely useful. It shows how much an asset typically moves, helping set realistic expectations — for example, an asset with a 0.5% ATR is unlikely to swing 10% in two days without a major catalyst.
The Average True Range helps traders set more informed expectations around price movement and manage risk more effectively. It can guide decisions like position sizing, stop-loss placement, and profit targets. Without understanding an asset’s average range of movement, it’s easy to overestimate the potential upside—or underestimate the downside.
Speedometer Analogy
Speedometers are essential when you’re driving. They tell you exactly how fast you’re moving, helping you adjust your behavior accordingly. Now, imagine driving without one — you’d be guessing whether you’re crawling along or speeding, and that’s both risky and stressful.
The Average True Range (ATR) serves a similar purpose in trading. It doesn’t tell you direction, but it does tell you how fast and far price is likely to move — in other words, it measures volatility.
A low ATR is like being stuck in rush hour traffic — moving at 0 to 10 mph. Price action is sluggish and constrained. The asset is trading in a tight range, and you might see only small gains or losses. Often, this signals a sideways or consolidating market.
A high ATR is like driving 70 miles per hour on the open highway. You’re covering a lot of ground quickly. In trading terms, this means the asset is experiencing large price swings. You might need to set wider stop-losses or adjust your profit targets, because the market can move significantly in either direction.
Without the ATR, you’re basically guessing how much a price could move. Let’s say two assets are trading at the same price — but one has an ATR of $10 and the other only $1. That’s a huge difference in potential opportunity and risk.
Average True Range Example
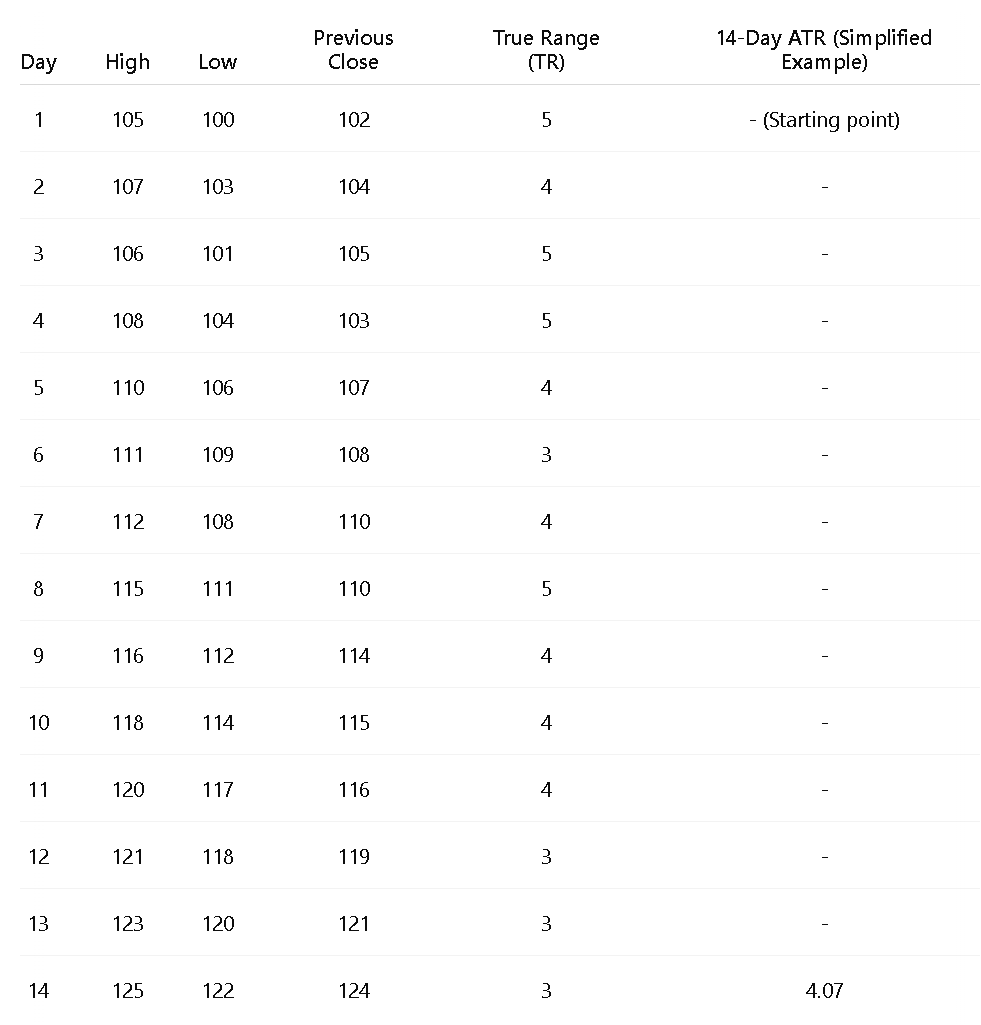
In Figure A, you’ll see an example where the Average True Range (ATR) is calculated to be 4.07. This value comes from summing the True Range (TR) values over the past 14 periods — which totals 57 — and dividing by 14:
57 ÷ 14 = 4.07.
ATR might not be the flashiest indicator, but in my experience, it’s one of the most practical and underrated tools in trading. It’s simple, but powerful. It has helped me set more realistic profit targets, place smarter stop-losses, and avoid jumping into trades based on hope instead of context.
For example, if the ATR for the day is $1, and the asset has already moved $0.90 by midday, there may not be much volatility left in the tank. At that point, I often ask myself: Is it worth entering this trade now, or has the market already done most of its moving for the day? ATR gives me a way to answer that with data, not emotion.
In Figure A, the example shows how the value of 4.07. The total of the true range column (TR) is 57. The table shows the past 14 periods. Hence the ATR is calculated by 57/14 = 4.07.
Underrated Indicator?
It is not the most exciting indicator out there, but it’s one of the most practical tools I’ve come across. It is very simple and has helped me to set more realistic profit targets and limit my losses. At the start of a day for example, if the ATR has been $1 and it moves $0.90 then there realistically is not much movement left for that day. It might not be worth entering a trade at that point.
Are you using the Average True Range (ATR) in your trading strategy — and if not, are you overlooking what I think is an underrated tool for managing risk and spotting opportunity?


Leave a Reply